August 2025
Weather & Electricity Price Dashboard
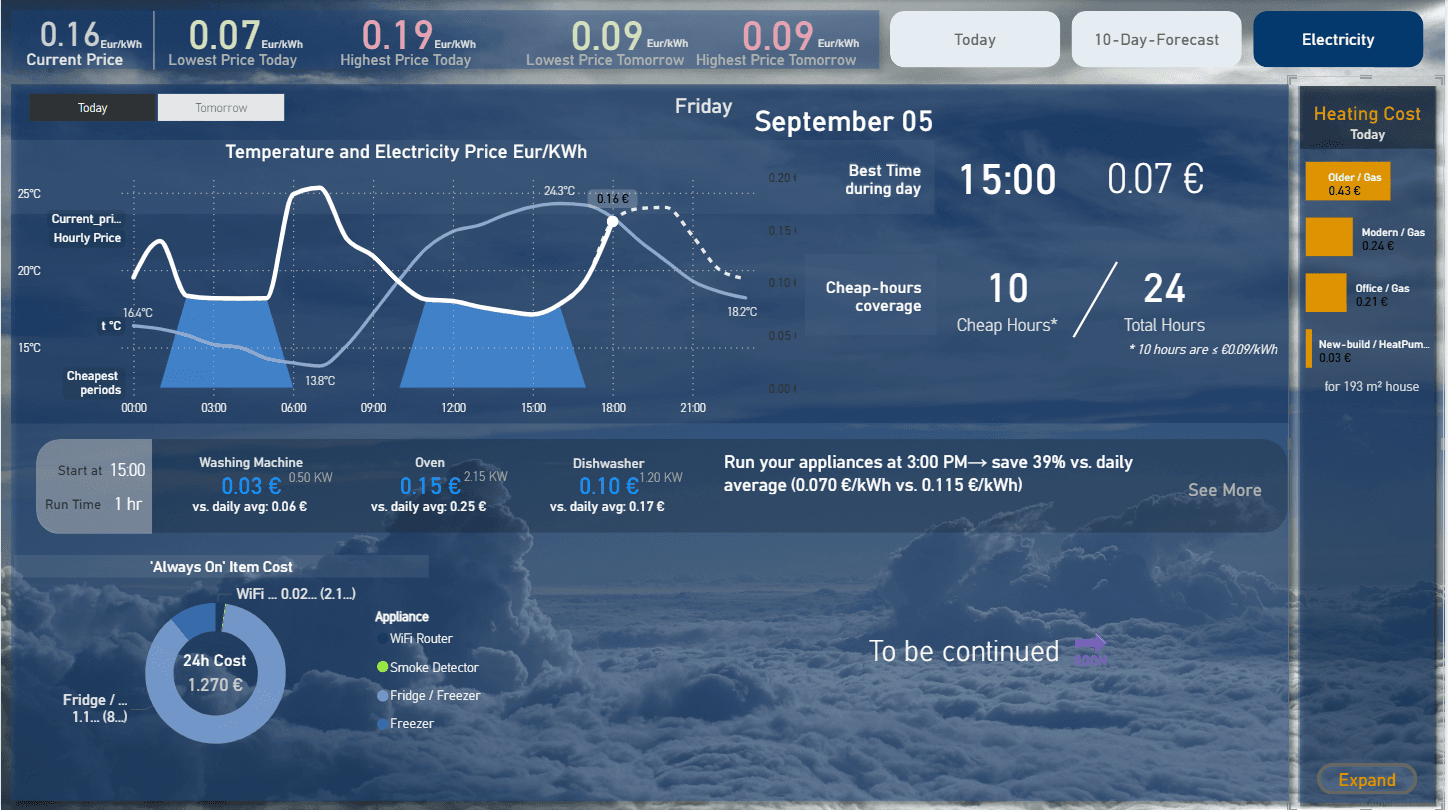
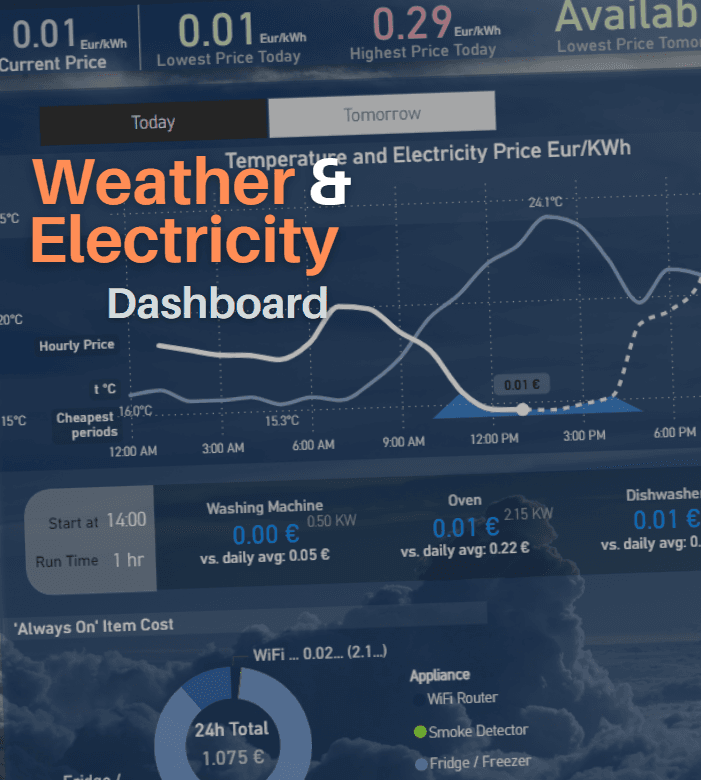
Electricity prices vary hour by hour. Most households have no idea. I built a Power BI dashboard that pulls live day-ahead prices and a 10-day weather forecast, then translates the numbers into plain decisions.
The problem
Hourly electricity prices in Latvia fluctuate significantly. Running high-consumption appliances at peak hours costs noticeably more. The data is publicly available from ENTSO-E, but it's raw numbers in a format nobody wants to parse before deciding when to run a dishwasher.
What I built
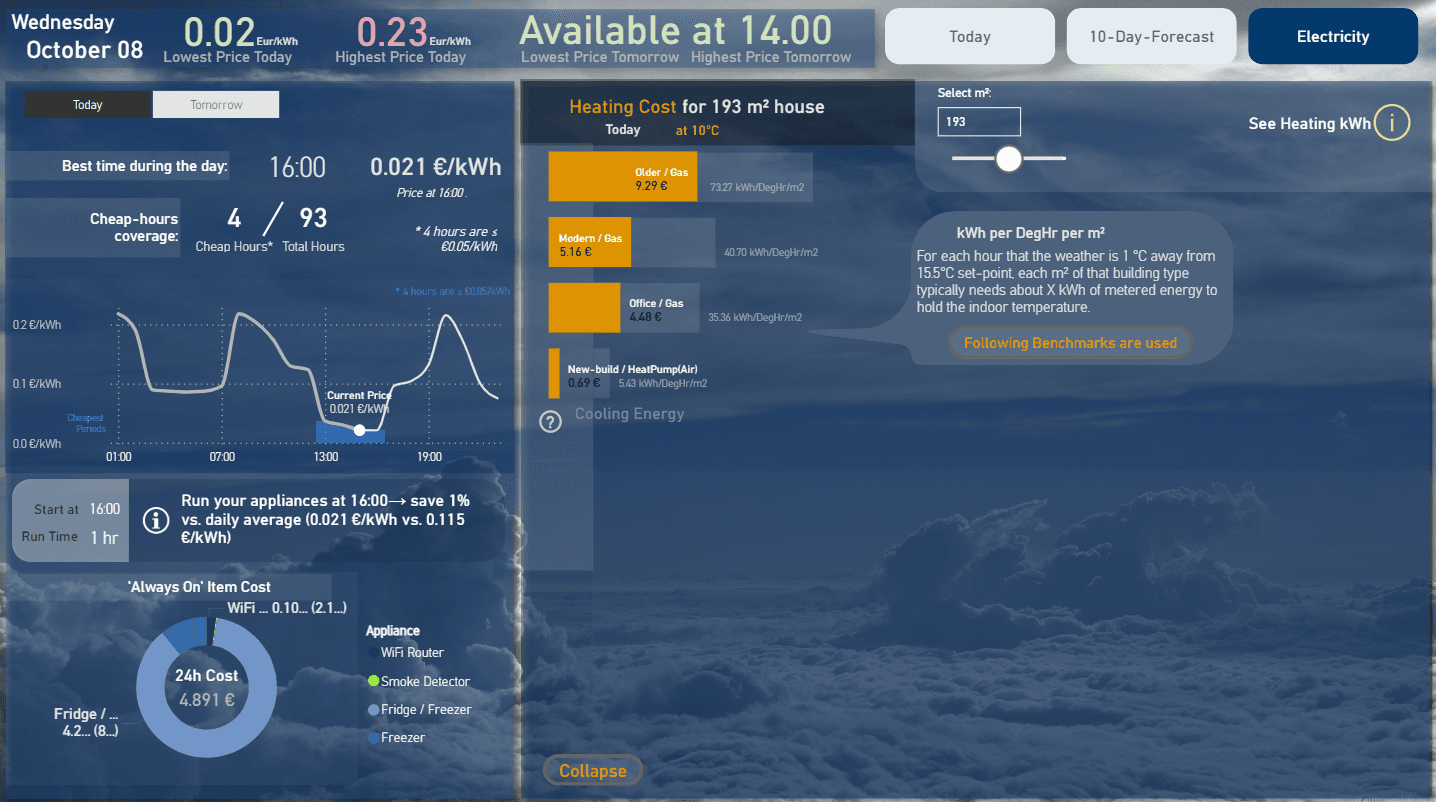
A three-page Power BI dashboard. Page one shows today's picture: current hour price, next-hour recommendation, and a single actionable line. Page two covers the 10-day weather forecast with comfort indicators. Page three shows pricing insights: the cheapest 2–3 hour windows and projected savings for common household tasks.
The parts worth explaining
Cost calculations had to account for tasks that span two hourly price windows. A 65-minute wash cycle doesn't fit neatly into one hour. I used SUMX with proportional rate logic: 60 minutes at the first hour's rate, 5 minutes at the second. The alert system encodes four weather risks as powers of 2, giving every possible combination a unique sum from 0 to 15, then translates those back into readable alerts: "High temperature and precipitation (31°C; 92%)."